AbstractThe Web was originally designed to be mashed up. The technology is finally growing up and making it possible.
Aaron Boodman
Greasemonkey creator
Mashups enable end-users to "mix and match" data and services available on the web to create applications. Their creation is supported by a complex ecosystem of i) data providers who offer open APIs to users, ii) users who combine APIs into mashups, and iii) platforms, such as the ProgrammableWeb or Mashape, that facilitate the construction and publication of mashups. In this article, we argue that the evolution of the mashup ecosystem can be explained in terms of ecosystem niches anchored around hub or keystone APIs. The members of a niche are focused on an area of specialization (e.g., mapping applications) and contribute their knowledge to the value proposition of the ecosystem as a whole. To demonstrate the formation of niches in the mashup ecosystem, we model groups of related mashups as species, and we reconstruct the evolution of mashup species through phylogenetic analysis.
Introduction
Mashups are situational applications that combine services provided by third parties through open APIs, as well as user-owned data sources (Matera and Weiss, 2011). A simple example of a mashup is an application that shows photos uploaded to Flickr on a map provided by Google Maps. The creation of mashups is supported by a complex ecosystem of interconnected data providers, users, and mashup platforms (Yu and Woodward, 2008; Weiss and Gangadharan, 2010). In our own previous work we have examined the structure and evolution of the mashup ecosystem (Weiss and Gangadharan, 2010), and mashup speciation (Weiss and Sari, 2011).
Our goal in this article is to explain the evolution of the mashup ecosystem through the lens of the speciation. Earlier research on technology evolution (Adner and Levinthal, 2002) has shown that the emergence of new technologies can be understood by tracing the evolutionary paths of technologies. By making visible how mashups can be “derived” from one another, we can provide data providers with a deeper understanding of future trends, users with templates on which to build their own mashups, and platform providers with an opportunity for building new types of tools. The article provides evidence of the formation of niches within the mashup ecosystem that are anchored around hub or keystone APIs, and it offers techniques for analyzing niche formation based on phylogenetics, the field that studies evolutionary relationships between organisms.
First, we review related work on recombinant innovation, ecosystems, and technology evolution. Then, we describe our research method and report on our findings on niche formation in the mashup ecosystem. We conclude the article with a discussion of our findings and areas for future work.
Related Work
Recombinant innovation
Innovation can be described as a process of recombination, in other words, the construction of new ideas from existing ones (Hargadon, 2002). The notion of recombinant innovation is closely linked to that of modularity, which allows the creation of new products by mixing and matching components (Ethiraj and Levinthal, 2004). Imitation is one of the primary means of innovation (Bentley et al., 2011). When developers are creating new mashups, they often start with another mashup as a “blueprint” for their own mashups (Weiss and Sari, 2011). Simulation models confirm that mashup development is largely the result of a copying process (Ethiraj and Levinthal, 2004).
Ecosystems
In an ecosystem, value is co-created by ecosystem members who both collaborate and compete (Thomas and Autio, 2012). Research on the mashup ecosystem has found that the distribution of API use follows a power law, implying that the ecosystem has a small number of hub APIs that provide the base functionality for a large number of complementors (Weiss and Gangadharan, 2010). Hubs naturally emerge in ecosystems (Thomas and Autio, 2012). These hubs provide the stable common assets for the mashup ecosystem. Co-creation of new functionality in the mashup ecosystem is anchored around those common assets.
As observed by Hagel and colleagues (2008) for innovation ecosystems, these hubs can be grouped into multiple tiers of keystones. The success of an ecosystem requires providing access to information on the innovation architecture, participating in standardization efforts, as well as investing in the providers of complements (West, 2006). These activities, performed by a focal company, facilitate cumulative innovation. An example is Google’s ecosystem (Iyer and Davenport, 2008). At its core is Google's vast computing infrastructure that enables Google to leverage third-party innovation while maintaining architectural control.
Technology evolution
Adner and Levinthal (2002) study the emergence of new technologies through the lens of biological speciation. They define speciation as the separation of one evolving population from its antecedent population. Speciation allows populations to follow different evolutionary paths. There are two processes at work: adaption (when technology becomes adapted to the needs of a particular niche) and resource abundance (how many resources are available in a niche to sustain the innovation).
Based on mechanisms of speciation and extinction, Weiss and Sari (2011) describe an evolutionary model that generate clusters of mashups, that is, niches in the mashup ecosystem, and they estimate the diversification of the mashup ecosystem over time. The model represents a mashup as an individual of an evolutionary species. They reconstruct the evolution of mashups through phylogenetic analysis.
Research Method
Data collection
The data for our study was collected from the ProgrammableWeb, a repository of open APIs and mashups. There are other websites that provide similar services, such as Mashape; however, the ProgrammableWeb provides the most comprehensive collection. It should be noted, though, that the ProgrammableWeb only lists publicly accessible mashups; internally used enterprise mashups are not listed.
The extracted data was used to produce datasets for the population of APIs and mashups in the mashup ecosystem. The API dataset included the name, publication date, and category of each API, and the mashup dataset included mashup name, publication date, tags, and APIs used. The sampling period was from September 4, 2005 (i.e., the inception of the mashup ecosystem) to January 22, 2013, and it includes 2656 days. Over this time period, a total of 8245 APIs (of which 1186 APIs were used in at least one mashup) and 6868 mashups were published in the repository.
Data analysis
To identify hub APIs, we compute the contributions of each API to mashups and rank them by the number of mashups they contribute to. We then determine the set of APIs that is responsible for one third of the contributions to mashups. (This cutoff is chosen according to Bradford’s law). This process provides a set of candidate hub APIs to be examined more closely by constructing phylogenetic trees in the next stage of the analysis.
To assess the relative impact that hub APIs have on the mashup ecosystem over time, we also compute their cumulative contributions. These curves will have the typical S-shape of an adoption cycle (Rogers, 1983). The inflection points in the S-curves mark events of significant interest to understanding the evolution of the ecosystem.
Finally, we reconstruct the evolution of the mashup ecosystem by constructing a phylogenetic tree of mashup species. A phylogenetic tree captures the evolutionary relationships between species of mashups. The tree was estimated using the neighbour-joining method (Gascuel, 1997), as implemented in the ape library (http://ape.mpl.ird.fr) in the statistics package R (http://www.r-project.org). A mashup species is a group of similar mashups.
Similar mashups will appear in related branches of the tree. The similarity of two mashups can be computed as the overlap in their APIs using the Jaccard index (Weiss and Sari, 2011). Each mashup can be represented as a set of APIs. For example, given two mashups m1 = {Google Maps, Flickr} and m2 = {Flickr, Amazon eCommerce}, the similarity is 1/3 = 0.33, because both mashups share Flickr and the total number of elements is 3.
Findings
Growth of hub APIs
Table 1 lists the candidate hub APIs and their contributions together with their date of introduction and category assigned to them on submission.
Table 1. Hub APIs and their contributions to mashups
|
Core API |
Contribution |
Date Published |
Category |
|
Google Maps |
2437 |
2005-12-05 |
Mapping |
|
|
759 |
2006-12-08 |
Social |
|
YouTube |
656 |
2006-02-08 |
Video |
|
Flickr |
615 |
2005-09-04 |
Photos |
|
Amazon eCommerce |
416 |
2006-04-04 |
Shopping |
|
|
392 |
2006-08-16 |
Social |
|
Twilio |
353 |
2009-01-10 |
Telephony |
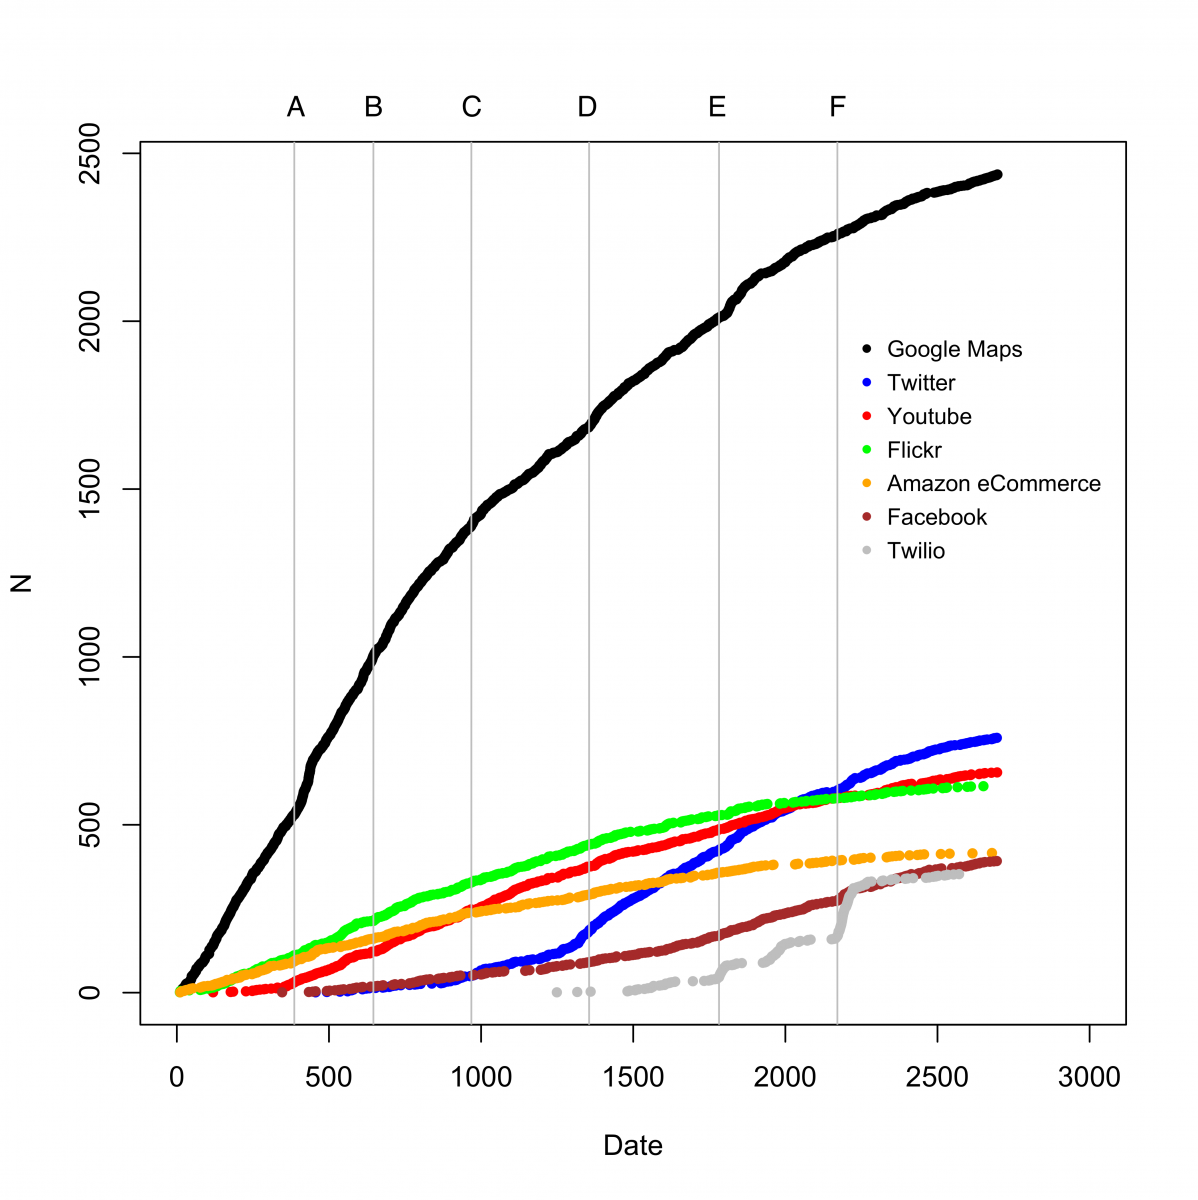
The graph in Figure 1 shows the cumulative contribution of each API. Initially, adoption of an API is low. This phase is followed by a period of steep growth and subsequent saturation. Some of the curves (e.g., Google Maps) only show the steep growth and subsequent saturation portions of the S-curve. Here, we can assume that the early stages of adoption precede the creation of the ProgrammableWeb. In other cases (e.g., Twilio), the whole adoption cycle is captured within the graph. The growth stage is when an API will make its greatest impact on the ecosystem. These are periods where one would expect “bursts of innovation” (Adner and Levinthal, 2002) driven by this API.
Figure 1. Contributions of hub APIs over time. Date is the number of days since inception of the mashup ecosystem. N is the number of mashups an API contributes to. Vertical lines marked with capital letters indicate the cumulative total number of mashups in 1000 increments.
Niche formation
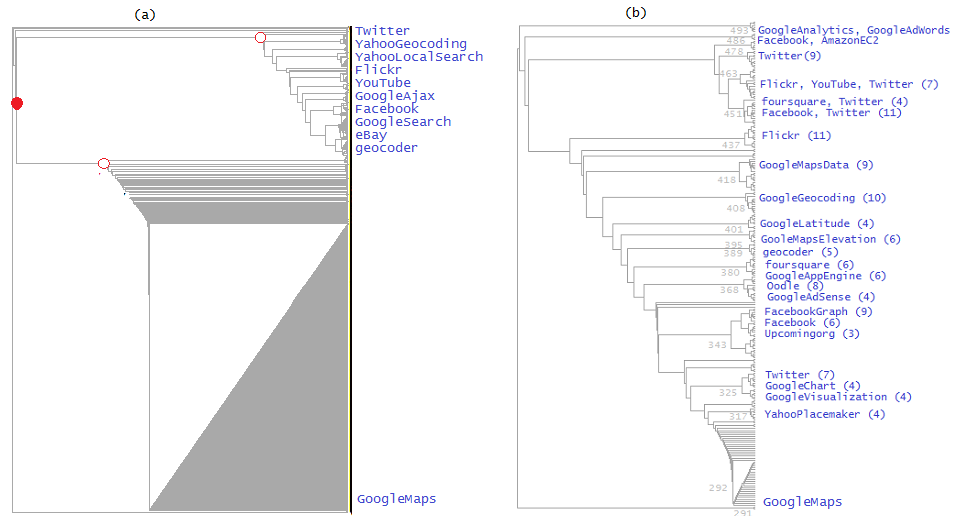
Expecting that niches are anchored around hub APIs, we constructed phylogenetic trees centered on those APIs to identify characteristics of the niches. In Figure 2, we indicated each cumulative 1000 mashup increment by a vertical line to allow cross-referencing between the evolution of hub APIs and the APIs in each niche.
As we examine these trees, we observe that the impact of hub APIs varies with time. API dominance and complementarity of APIs are some of the interesting observations we can make. For instance, in Figure 2a we can observe the initial dominance of Google Maps, as represented by a cluster of mashups that only use Google Maps. Later, as shown in Figure 2b, the clusters become more evenly distributed, because there are more clusters with APIs that complement GoogleMaps, such as Twitter and YouTube, or other APIs by Google, such as GoogleSearch.
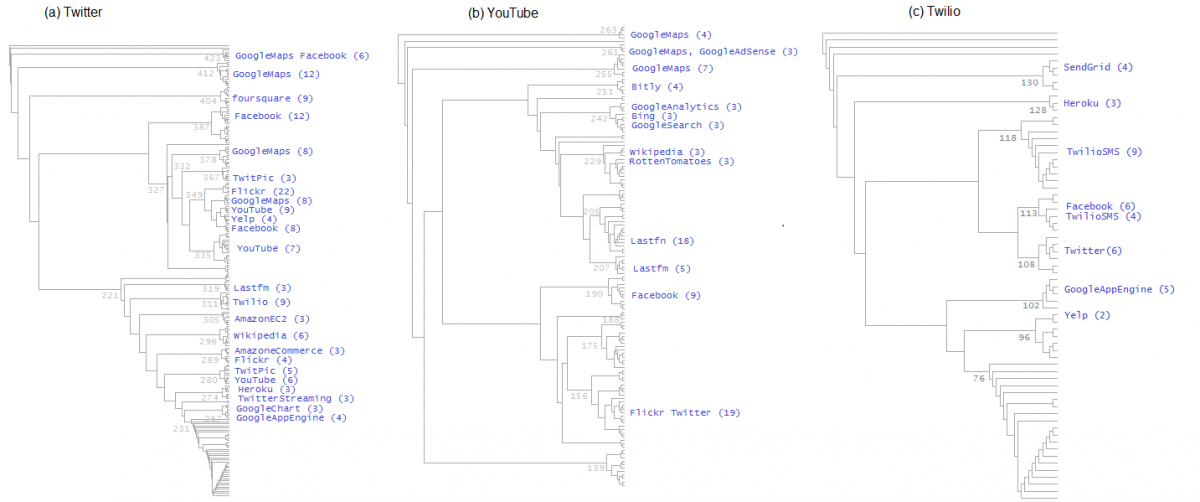
One way to understand the impact of hub APIs on the evolution of the mashup ecosystem is to align growth stages in their S-curves (see Figure 1) with the phylogenetic trees for the corresponding time window. Figure 3 offers a more detailed perspective of each of the APIs complementing Google Maps past the 5000 mashups' mark (E). It shows the phylogenetic trees for Twitter, YouTube, and Twilio. Each of these APIs creates a niche within the mashup ecosystem, where it drives the evolution of this niche as its hub API. A similar analysis can be conducted within each of those niches. We can identify sub-niches such as the niche anchored around Facebook in the Twitter niche (Figure 3a), and Last.fm in the YouTube niche (Figure 3b).

Figure 2. Phylogenetic trees comparing Google Maps API evolution (a) before and (b) after 1727 days. This date correspond to 5000 mashups (marked with an E in Figure 1).

Figure 3. Phylogenetic trees of the Twitter, YouTube, and Twilio niches after 1727 days.
Conclusion
Our research introduces a new methodology, based on phylogenetic trees, to analyze the mashup ecosystem. Phylogenetic trees allow us to trace the evolution of mashups from simple mashups to complex combinations of APIs, and to identify hub or keystone APIs around which new mashups are constructed. We can, thus, describe the evolution of the mashup ecosystem in terms of ecosystem niches formed around those keystone APIs, and niches within those niches. This model allows API providers and mashup developers to gain a deeper insight into future trends and opportunities.
Future research can explore a new generation of mashup directories that allow developers to browse a “tree of life” of mashups and to discover new opportunities for mashups. Such a directory could also be used by providers to learn about emerging needs for new APIs. Furthermore, we can apply the methodology to different areas. Of particular interest to readers of this journal is the possibility of understanding the evolution of open source projects using trees based on project dependencies.
Keywords: ecosystems, evolution, growth, keystones, mashups, niche formation, recombinant innovation, speciation


Comments
Link to Mashape
Hi guys, great analysis! Would appreciate it if you can add a link to mentions of Mashape (http://www.mashape.com/) Thanks! - Chris