“About eighty percent of all data stored in corporate databases has a spatial component.”
Carl Franklin
Recently, interest in the huge potential of Geospatial BI has increased. It aims at combining geographic information system (GIS) and business intelligence (BI) technologies. Geospatial BI combines spatial analysis and map visualization with proven BI tools in order to better support the corporate data analysis process and to help companies make more informed decisions.
BI is a business management term which refers to applications and technologies that are used to gather, provide access to, and analyze data and information about company operations. BI applications are usually used to better understand historical, current and future aspects of business operations. BI applications typically offer ways to mine database- and spreadsheet-centric data to produce graphical, table-based and other types of analytics regarding business operations. BI systems give companies a more comprehensive knowledge of the factors affecting their business, such as metrics on sales, production, and internal operations, in order to to make better business decisions.
This article provides a rapid introduction to some important BI concepts. It then highlights the need for geospatial BI software and deals with the integration of the spatial component in a BI software stack in order to consistently enable geo-analytical tools. We then present different works performed and tools designed by the GeoSOA research group.
A Rapid Introduction to BI
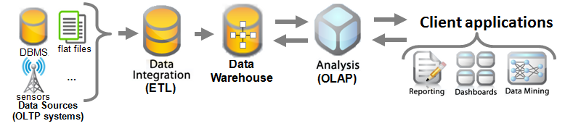
BI applications rely on a complex architecture of software that is usually composed of:
-
An extract/transform/load (ETL) tool to extract data from different heterogeneous sources, provide integration and data cleansing according to a target schema or data structure, and load the data in a data warehouse.
-
A data warehouse which stores the organization’s historical data for analysis purposes.
-
An online analytical processing (OLAP) server which enables the rapid and flexible exploration and analysis of the large amount of data stored in the data warehouse.
-
On the client side, some reporting tools, dashboards and/or different OLAP clients to display information in a graphical and summarized form to decision makers and managers. These tools offer capabilities to explore data interactively and support the analysis process.
-
Optionally, some data mining tools to automatically retrieve trends, patterns and phenomena in the data.
Figure 1 illustrates the typical infrastructure on which BI applications rely.
Figure 1: Classical Architecture for Deploying BI Applications
The data warehouse plays a central and crucial role in this architecture. It is the repository of an organization’s historical data. It is separate from operational data sources but is often stored in relational database management systems. Data warehouses are optimized for handling large volumes of data, providing fast response during the analysis process, and handling complex analytical queries. They rely on de-normalized data schemas which introduce some redundancy to provide very fast replies to time consuming queries involved in analytical requests.
A data warehouse focuses more on the analysis and the correlation of large amounts of data than on retrieving or updating a precise set of data. This is fundamentally different to the functions of the transactional database systems used in the day to day activities of a company.
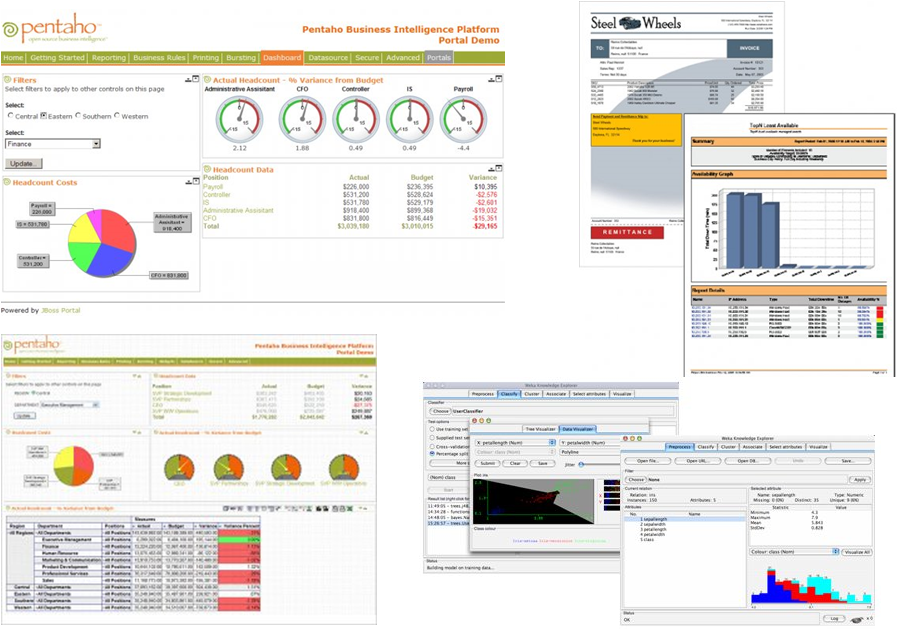
Contents of the data warehouse are often presented in a summarized form primarily for analysts and decision makers. Figure 2 illustrates different tools from Pentaho used to present, explore and analyse data.
Figure 2: Dashboards, Reporting and Data Mining Tools
To query the data warehouse, these tools generally use the MultiDimensional eXpressions (MDX) query language implemented by the OLAP server. MDX is a de facto standard from Microsoft which is also implemented by other OLAP servers and clients. MDX is for OLAP data cubes what the structured query language (SQL) is for relational databases. Queries are similar to SQL but rely on a model closer to the one used in spreadsheets.
OLAP client software propose alternate representation modes, such as pie charts and diagrams, and different tools to refine queries and to explore data. These tools are based on operators provided by the MDX query language and on a complex logic implemented in the client. The spatial component of data can be used to enhance the BI user experience with map displays and spatial analysis tools to better support the analysis and decision processes.
Merging BI and GIS Software
It is difficult for a decision maker to answer complex questions like: where are the urban spots that are more sensitive to heat waves, intense rain, flooding or droughts in a specific geographic area? How many people with cardiovascular, respiratory, neurological and psychological diseases will there be in 2025 and 2050 in a specific geographic area? How many people with low income live alone in a building requiring major repairs in a specific geographic area?
To answer such questions, you can use:
1. GIS: implies writing very complex SQL queries and dedicated human resources. Moreover, this job needs to be done anew every time data change or new analyses have to be achieved.
2. Classical BI tools: are often unable to handle the spatial dimension of data or only provide a very basic support. Some phenomena can only be adequately observed and interpreted by representing them on a map. This is especially true when you want to observe the spatial distribution of a phenomenon or its spatiotemporal evolution.
Geospatial BI has recently stirred marked interest for the huge potential of combining spatial analysis and map visualization with proven BI tools.
Tools recently made available on the market rely on a loose coupling between existing GIS software and some proven BI components. They provide first solutions to display maps with summarized and aggregated information stemming from the BI infrastructure while GIS data have to be stored and managed in a separate and transactional database system or GIS data file. These solutions manage geospatial and corporate data in different systems which require additional efforts, resources and costs to consistently feed and maintain them. They also do not fully take advantage of the powerful analytical capabilities of a classical BI infrastructure and usually are not able to handle very large data volumes. This loose coupling often requires the development of dedicated applications each time a new analytical need emerges in the company.
The geometry data type on which geospatial data relies is not handled as any other data type in the BI infrastructure and connections with the GIS have to be carefully initiated and maintained. Drill down and roll-up capabilities in the analytical data to observe data at different levels of detail, time or scale are often not supported by the map display because they are not intrinsic operators available in GIS. This is mainly due to the transactional structure of geospatial data in the underlying GIS software. Dimensional data structures on which BI tools rely are more efficient to quickly reply to complex analytical queries which would have involved numerous time consuming join queries in a transactional system.
Consistently integrating the geospatial component in all parts of the BI architecture is required. Figure 3 illustrates that all components of the BI infrastructure have to be spatially-enabled.
Figure 3: Integrating the Spatial Component into a Classical BI Infrastructure
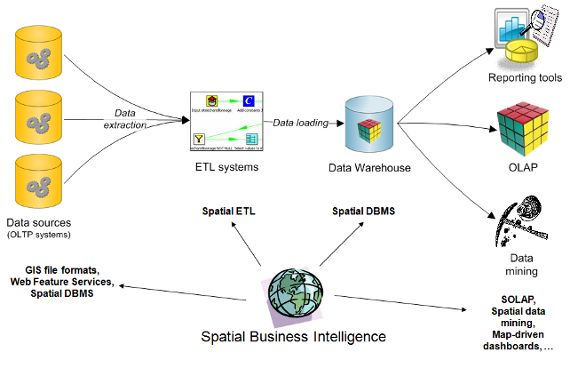
Some spatial capabilities such as support for reading and writing GIS file formats, coordinate transformations, and spatial reference systems need to be injected into ETL tools. OLAP servers should be extended to become actual Spatial On-Line Analytical Processing (SOLAP) servers. SOLAP should bring the consistent handling of geospatial features, map displays and spatial analysis capabilities. SOLAP servers and clients should “allow a rapid and easy navigation within spatial data warehouses and offer many levels of information granularity, many themes, many epochs and many display modes of information that are synchronized or not: maps, tables and diagrams”.
In this perspective and in order to not reinvent the wheel, the GeoSOA Research Group at Laval University, Quebec, Canada started to consistently and completely integrate the geospatial functionalities into an existing, mature, efficient and reputed open source BI software stack.
A complete open source BI software stack is offered by Pentaho. It includes:
-
an ETL tool to integrate data from heterogeneous sources to a data warehouse
-
an OLAP server which provides multidimensional query facilities on top of the data warehouse
-
reporting and dashboard tools, used to present data to analysts
The integration of the Pentaho software suite with open source GIS components has been investigated to create a complete spatially-enabled BI solution. This work has led to the implementation of GeoKettle, GeoMondrian and SOLAPLayers.
GeoKettle
GeoKettle is a spatially-enabled version of Pentaho Data Integration (PDI), formerly known as Kettle. It is a powerful, metadata-driven spatial ETL tool dedicated to the integration of different spatial data sources for building and updating geospatial data warehouses. GeoKettle enables the transparent handling of the geometry data type as any other classical data type to all transformations available in Kettle. It is possible to access geometry objects in JavaScript and to define custom transformation steps. Topological predicates have all been implemented.
GeoKettle has been released under the LGPL. Figure 4 illustrates the GeoKettle user interface showing a basic geospatial data transformation.
Figure 4: GeoKettle Interface
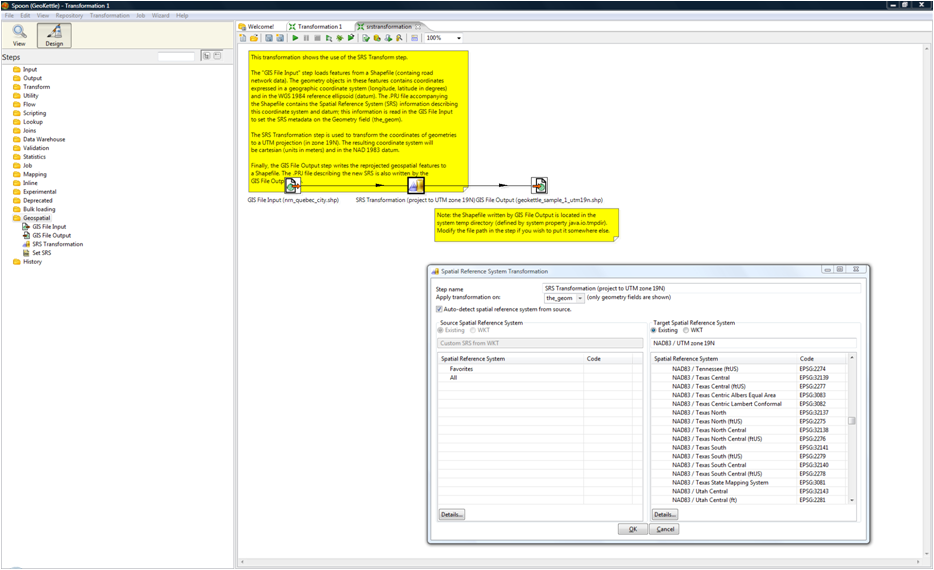
At present, Oracle spatial, PostGIS, and MySQL with ESRI shapefiles are natively supported in read and write modes. At present, Microsoft SQL Server 2008, Ingres, and IBM DB2 can be used with some modification. It is possible to build and feed complex and very large geospatial data warehouses with GeoKettle. Spatial reference systems management and coordinate transformations have been fully implemented. Native support for unsupported geospatial databases and raster and vector based data formats will be implemented in the near future as an active and growing community has federated around the project.
GeoKettle releases are aligned with PDI, allowing GeoKettle to benefit from all the new features provided by PDI. For instance, Kettle is natively designed to be deployed in cluster and web service environments. This makes GeoKettle suitable for deployment as a service in cloud computing environments. It enables the scalable, distributed and on demand processing of large and complex volumes of geospatial data in minutes for critical applications, without requiring a company to invest in an expensive infrastructure of servers, networks and software.
Upcoming features to be implemented in GeoKettle include:
-
cartographic preview
-
implementation of data matching steps to allow geometric data cleansing and comparison of geospatial datasets
-
read/write support for other database, GIS file formats and geospatial web services
-
native support for MS SQL Server 2008 and Ingres
-
implementation of a spatial analysis step through a graphical interface
GeoMondrian
GeoMondrian is a spatially-enabled version of Pentaho Analysis Services (Mondrian). It has been released under the EPL.
As far as we know, GeoMondrian is the first implementation of a true SOLAP server. It provides a consistent integration of spatial objects into the OLAP data cube structure, instead of fetching them from a separate spatial database, web service or GIS file. To make a simple analogy, GeoMondrian brings to the Mondrian OLAP server what PostGIS brings to the PostgreSQL database management system. It implements a native geometry data type and provides spatial extensions to the MDX query language, allowing embedding spatial analysis capabilities into analytical queries.
These geospatial extensions to the MDX query language provide many more possibilities, such as:
-
in-line geometry constructors
-
member filters based on topological predicates
-
spatial calculated members and measures
-
calculations based on scalar attributes derived from spatial features
At present, GeoMondrian only supports PostGIS based data warehouses but other databases should be supported soon.
SOLAPLayers
Formerly known as Spatialytics, SOLAPLayers is a lightweight web cartographic component which enables navigation in SOLAP data cubes. It aims to be integrated into existing dashboard frameworks in order to produce interactive geo-analytical dashboards. The first version of SOLAPLayers stems from a Google Summer of Code (GSoC) 2008 project performed under the umbrella of OSGeo. The client is released under the BSD license and the server under the EPL.
SOLAPLayers is based on the OpenLayers web mapping client and uses olap4j for connection to OLAP data sources. For now, it requires GeoMondrian to display members of a geospatial dimension on a map. SOLAPLayers allows the:
-
connection with a spatial OLAP server such as GeoMondrian
-
navigation in geospatial data cubes
-
cartographic representation of some measures and members of a geospatial dimension as static or dynamic choropleth maps and proportional symbols
A demo application is available online. It demonstrates the interaction with GeoMondrian and how the cartographic navigation in the geospatial data cube is performed.
Upcoming features in the development for SOLAPLayers include:
-
more map-driven OLAP navigation operators
-
dimension member selection and navigation controls
-
legend display
-
new choropleth and graphics mapping styles
-
styles for other geometry types
-
multi maps
Conclusion
This article has highlighted the need for geospatial BI software and has emphasized that spatially-enabling a BI software stack requires the consistent integration of the spatial component and its functionalities into each component of the BI infrastructure. Works performed by the GeoSOA research group have led to the release of three open source building blocks of a consistent and powerful geo-BI software stack.
Based on these key software components, future works deal with the design of a geo-analytical dashboard framework. In order to easily design and deliver dashboards which embed some geospatial components and representations, a highly customisable and flexible geo-analytical dashboard framework is required. A first integration of SOLAPLayers with JasperServer and iReport has recently been performed in the GeoSOA research group. The result of this integration allows displaying information in different ways and the synchronisation between the different representations when the user drills down or rolls up on the map or the charts.
More recently, some experiments dealing with the integration of SOLAPLayers into the Pentaho Community Dashboard Framework (CDF) have been performed in the context of a GSoC 2009, under the umbrella of OSGeo.
The integration work performed by the student during this period allows the display of the SOLAPLayers cartographic component together with a pivot table component in a CDF dashboard. Synchronisation between the map and the pivot table has been implemented. Further work is required in order to more properly and consistently integrate the SOLAPLayers component into CDF, but it represents a good and promising first step towards the design of a highly customisable and flexible geo-analytical dashboard framework. A live demo of the integration work performed by the student will be available shortly. The source code will also be available in the GSoC 2009 repository.
The reader is invited to consult the presentation about the research challenges dealing with the integration of the spatial component in BI tools and the design of intelligent mobile applications for better decision support. These research challenges are currently part of the research agenda of the GeoSOA research group.
This article is a short version of the original paper written for this special issue on Business Intelligence for the OSBR. The full version can be freely downloaded here.